A Global Guide to Profitability Analysis for SMEs
In a competitive global marketplace, growth is no longer driven by expanding product lines, adding more customers, or entering new geographic markets alone. For seasoned SME leaders, sustainable growth depends on mastering profitability analysis—the discipline of understanding exactly which products, clients, and regions generate disproportionate value.
High-performing SMEs across Asia, the Middle East, Africa, Europe, and the Americas increasingly rely on profitability analytics to sharpen their strategy, prune inefficiencies, and focus capital where returns are highest. The goal is simple: Stop guessing. Start measuring.
Why Profitability Analysis Matters More Today
Most SMEs track revenue deeply but profit only broadly. The result?
They celebrate “top-line growth” while unknowingly subsidizing loss-making products, discount-heavy clients, or expensive distribution regions.
Global supply chain volatility, rising compliance costs, talent shortages, and margin pressure make precision essential. Profitability analysis gives SME leaders the visibility needed to:
- Protect margins in inflationary markets
- Allocate resources to high-return segments
- Decide which offerings to scale or sunset
- Negotiate client terms with clarity
- Optimise pricing for different regions
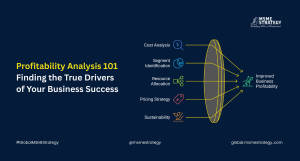
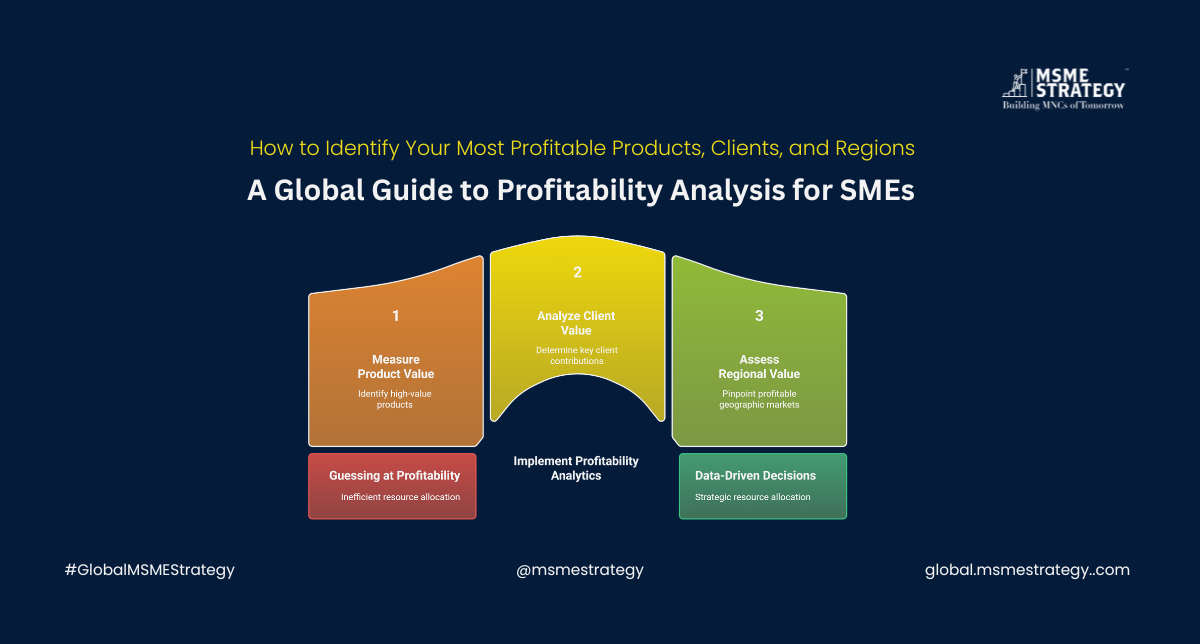
1. Product Profitability: Find What Truly Drives Margin
A product with the highest sales is often not the most profitable. Global SMEs frequently overlook the hidden costs buried inside production, logistics, returns, and channel commissions.
Key Metrics to Track
- Contribution margin per unit
- Total cost-to-serve (manufacturing, warehousing, shipping, returns)
- Gross margin by channel (retail, distributor, direct online)
- SKU-level performance over time
Global Insight
Across Europe and East Asia, SMEs that conduct SKU rationalization every 12–18 months reduce costs by 8–12% while boosting margins. The leaner product portfolio focuses on high-margin, high-velocity items.
Questions to Ask
- Which SKUs consistently outperform on margin?
- Which products require excessive discounts or after-sales service?
- Are there region-specific costs increasing the cost-to-serve?
2. Client Profitability: Not All Customers Are Equal
Many SMEs treat large clients as “strategic” even when they erode margins through high negotiation power, late payments, or customisation demands.
Client Profitability Factors
- Net margin from each client
- Payment behaviour (DSO patterns across regions)
- Order consistency and predictability
- Service or customisation cost
Global Insight
In North America and Australia, SMEs increasingly adopt customer segmentation by profitability, not size. They prioritise high-margin customers for personalised service while redesigning or exiting unprofitable accounts.
Questions to Ask
- Which customers pay full price and have low overhead needs?
- Who demands deep support or extended credit terms?
- Are your “largest accounts” truly your “best accounts”?
3. Regional Profitability: Geography Shapes Margins
Expanding to new regions—domestic or international—can create growth or hidden cost drains. While revenue potential may be high, logistics, compliance, distribution margins, or tax structures can erode profitability.
Region-Level Metrics
- Landed cost and logistics expense
- Regional pricing power
- Tax and compliance obligations
- Local competitive intensity
- Exchange rate exposure
Global Insight
Latin American and African SMEs who perform region-based profitability mapping often uncover that 20–40% of their regional sales contribute less than 5% of net profit.
Questions to Ask
- Are certain regions generating low margins despite strong revenue?
- Does pricing reflect local cost realities?
- Are distributors or channel partners reducing profitability?
4. Integrating Profitability Data: Building a Single View
Leading SMEs worldwide integrate product, client, and regional profitability into a Unified Profitability Dashboard.
This allows leaders to:
- Identify high-margin crossover segments (e.g., “Product B + Region 2 + Client Type X”)
- Optimise pricing through differentiated strategies
- Forecast profits accurately for financial planning
- Redirect capital from low-yield to high-yield segments
Whether using spreadsheets, ERP modules, or advanced BI platforms, the principle remains the same: Make profitability visible.
5. Common Profitability Blind Spots in SMEs
- Treating all revenue as equally valuable
- Underestimating cost-to-serve in different geographies
- Misallocating sales incentives to high-revenue but low-margin deals
- Ignoring the impact of client behaviour on profitability
- Not updating cost structures regularly as global prices change
Actionable Steps for SME Leaders
Use these steps to immediately enhance profitability clarity across your operations:
1. Conduct a Margin Audit
Break down gross and net margins by product, client, and region.
2. Create a Cost-to-Serve Model
Include logistics, manpower, compliance, credit costs, and after-sales support.
3. Rank Products and Clients by Profitability
Identify top 20% high-profit items and customers—double investments here.
4. Revisit Pricing Strategies
Adopt differentiated pricing for regions and customer categories.
5. Exit or Redesign Low-Profit Segments
Streamline SKUs, adjust client terms, or change distribution models.
6. Build a Unified Profitability Dashboard
Use ERP/BI tools to track margins in real time with clear visual signals.
7. Re-evaluate Every 6–12 Months
Periodic reviews help SMEs remain resilient to global market swings.
#GlobalMSMEStrategy #ProfitabilityAnalysis #ProductProfitability #ClientProfitability #RegionalMargins #SMEGrowth #BusinessStrategy #SMELeadership #SustainableGrowth
About MSME Strategy Consultants
At MSME Strategy Consultants (global.msmestrategy.com), our experienced consultants help SMEs worldwide design profitability-driven strategies, optimise portfolios, and build data-backed decision systems for sustained growth.