Over the last two decades of working with SMEs across Asia, Europe, and Africa, we’ve seen one recurring pattern: leaders often make crucial business decisions based on outdated, incomplete, or overly generalized reports. In dynamic markets, waiting until the end of the quarter to learn your gross margin has slipped is simply too late.
A well-structured KPI dashboard—designed with profitability at its core—isn’t just a reporting tool; it’s your real-time business command center. This article distills our consulting playbook for implementing dashboards that don’t just track numbers but guide strategic decisions across borders and market conditions.
Why This Matters Globally
The global SME environment is defined by:
- Shorter decision cycles — Competitive advantage now depends on speed as much as on accuracy.
- Cross-border complexity — Compliance requirements in the EU, logistics delays in Africa, or currency volatility in Latin America can all impact daily metrics.
- Data democratization — Even the smallest SME can access cloud-based BI tools once reserved for corporates.
SMEs that succeed globally tend to build a “data habit” early—checking and acting on KPIs daily, not monthly. One client in Southeast Asia shifted from paper-based sales tracking to a live dashboard integrated with inventory systems; within six months, they had cut stock-outs by 40% and freed up 15% in working capital.
Common Challenges SMEs Face in This Area
- Vanity Metrics Overload – Many SMEs focus on easily available but low-value metrics like social media likes, while ignoring high-impact operational metrics such as debtor days or inventory turnover.
- Lack of Context – A KPI without a benchmark or target is just noise; I’ve seen dashboards with 50+ metrics where decision-makers didn’t know which ones to act on.
- Poor Metric Hygiene – Inconsistent definitions of terms like “active customer” across regions cause misleading comparisons.
- Delayed Reaction Loop – By the time the finance team closes books and circulates reports, opportunities have already been missed.
- Overcomplicating Tech – SMEs sometimes invest in expensive BI systems without first aligning on what they actually need to measure.
Step-by-Step Framework: KPI-Based Profitability Analysis
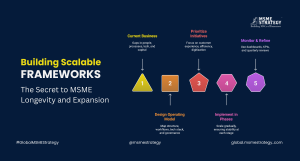
Step 1: Diagnose Current Visibility Gaps
- Ask each department: What is the single number that tells you if today was a good day?
- Identify lagging reports and high-friction manual processes that slow decision-making.
Step 2: Select a Core KPI Set (5–10 max)
- Include leading indicators (e.g., pipeline velocity, quote-to-close ratio) that predict revenue changes, not just report them afterward.
- For global SMEs, layer in currency-adjusted margin to avoid misleading profitability signals.
Step 3: Integrate & Standardize Data Sources
- Even a basic integration of sales, finance, and operations data can surface hidden profitability leaks—like a client we helped uncover a low-margin customer segment draining 25% of service capacity.
Step 4: Link KPIs to Profitability Levers
- Segment KPIs by driver category—Revenue Growth, Cost Efficiency, Asset Utilization.
- Example: A rising customer acquisition cost should immediately trigger a review of marketing ROI, not just a note in the next quarterly review.
Step 5: Implement Real-Time Monitoring & Alerts
- Set trigger thresholds (e.g., gross margin drops below 32%, lead time exceeds 5 days) so corrective action is taken same-day.
Step 6: Review & Refine Quarterly
- Remove KPIs that no longer serve a decision-making purpose.
- Expand KPI scope when entering new markets—e.g., adding compliance metrics when exporting to new jurisdictions
Best Practices & Strategic Insights
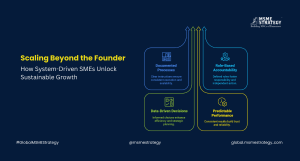
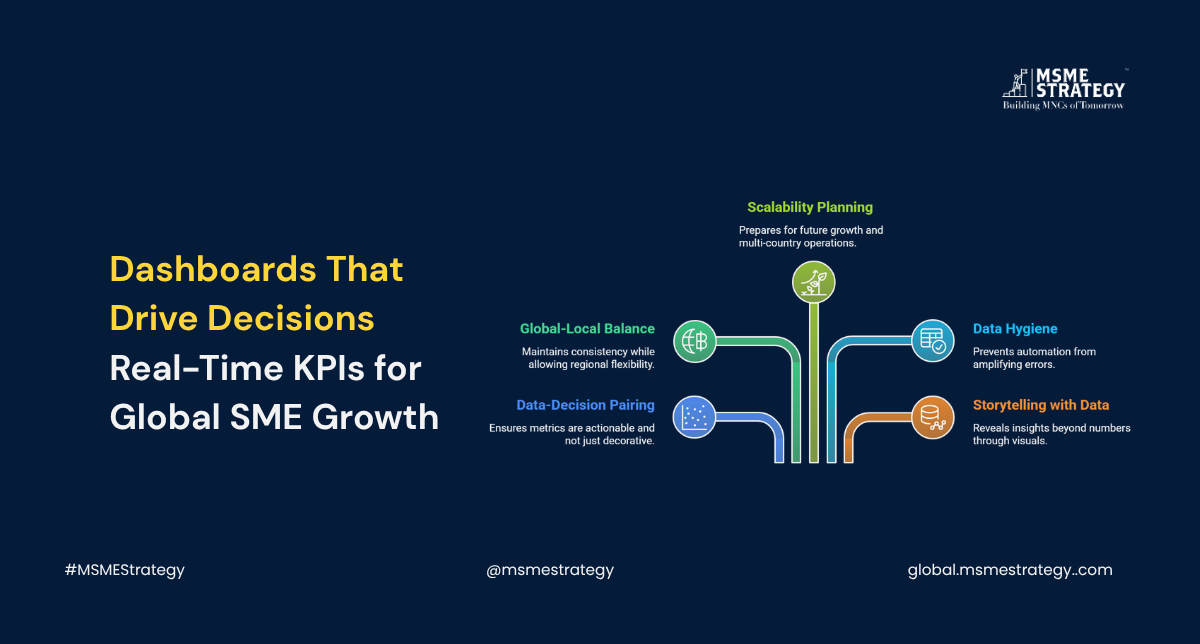
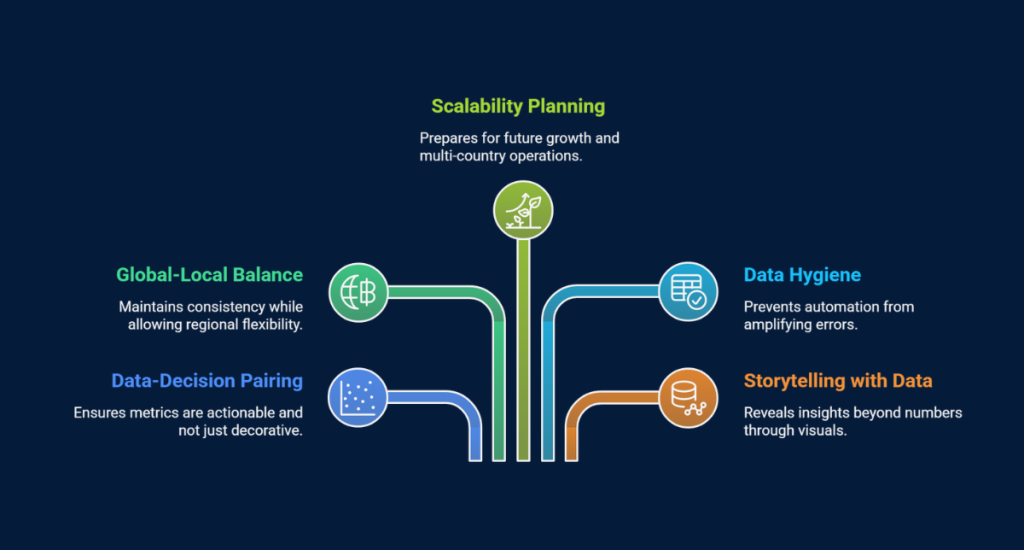
- Always Pair Data with a Decision Path – A metric without a clear “if this, then that” plan is just decoration on a dashboard.
- Balance Global Consistency with Local Reality – Keep definitions standard, but allow regions to set realistic local targets.
- Build for Scalability – Don’t design a dashboard just for current size; anticipate multi-country operations.
- Don’t Automate Bad Data – Automation magnifies errors; get your data hygiene right first.
- Tell a Story, Not Just a Number – Use visual trends and drill-downs to reveal the why behind the data.
Actionable Recommendations
- Audit your current reporting cadence and identify bottlenecks in decision-making.
- Strip your KPI set down to no more than 10 high-impact metrics.
- Implement at least one integrated dashboard tool (even if starting with low-cost options like Zoho Analytics or Google Data Studio).
- Train department heads to interpret KPIs in the context of profitability levers.
- Establish KPI accountability—assign metric owners with clear thresholds and action responsibilities.
- Run monthly “KPI health checks” to ensure relevance and accuracy.
KPI dashboards are not about technology—they’re about discipline and clarity. A live dashboard won’t fix poor decision-making, but in the hands of a decisive SME leader, it becomes a compass that keeps the business aligned, profitable, and competitive in any market.
At MSME Strategy Consultants (global.msmestrategy.com), our experienced consultants partner with SMEs worldwide to identify growth opportunities, optimize resources, and future-proof operations.
#GlobalMSMEStrategy #SMEGrowth #BusinessStrategy #GlobalMarkets #ScaleUpSmart #SMELeadership #Profitability #InnovationForSMEs